
学士
バスケットボール選手の特徴分類とシュート傾向の可視化
ソフトウェアデザインスタジオ
#UXデザイン#インフォメーションデザイン#インタラクションデザイン
近年,スポーツ分野においてデータ分析および可視化技術の活用が進展している.本研究は,バスケットボール観戦において,プレー理解とデータ活用が十分に接続されていないという課題に着目し,観戦中に選手の判断文脈および特徴を直感的かつ定量的に理解できる表現手法の構築を目的とする.従来,シュート成功率やシュート位置などの詳細なデータは取得可能であるものの,映像と分断されて提示されることが多く,観戦体験とデータ理解の両立は困難であった.
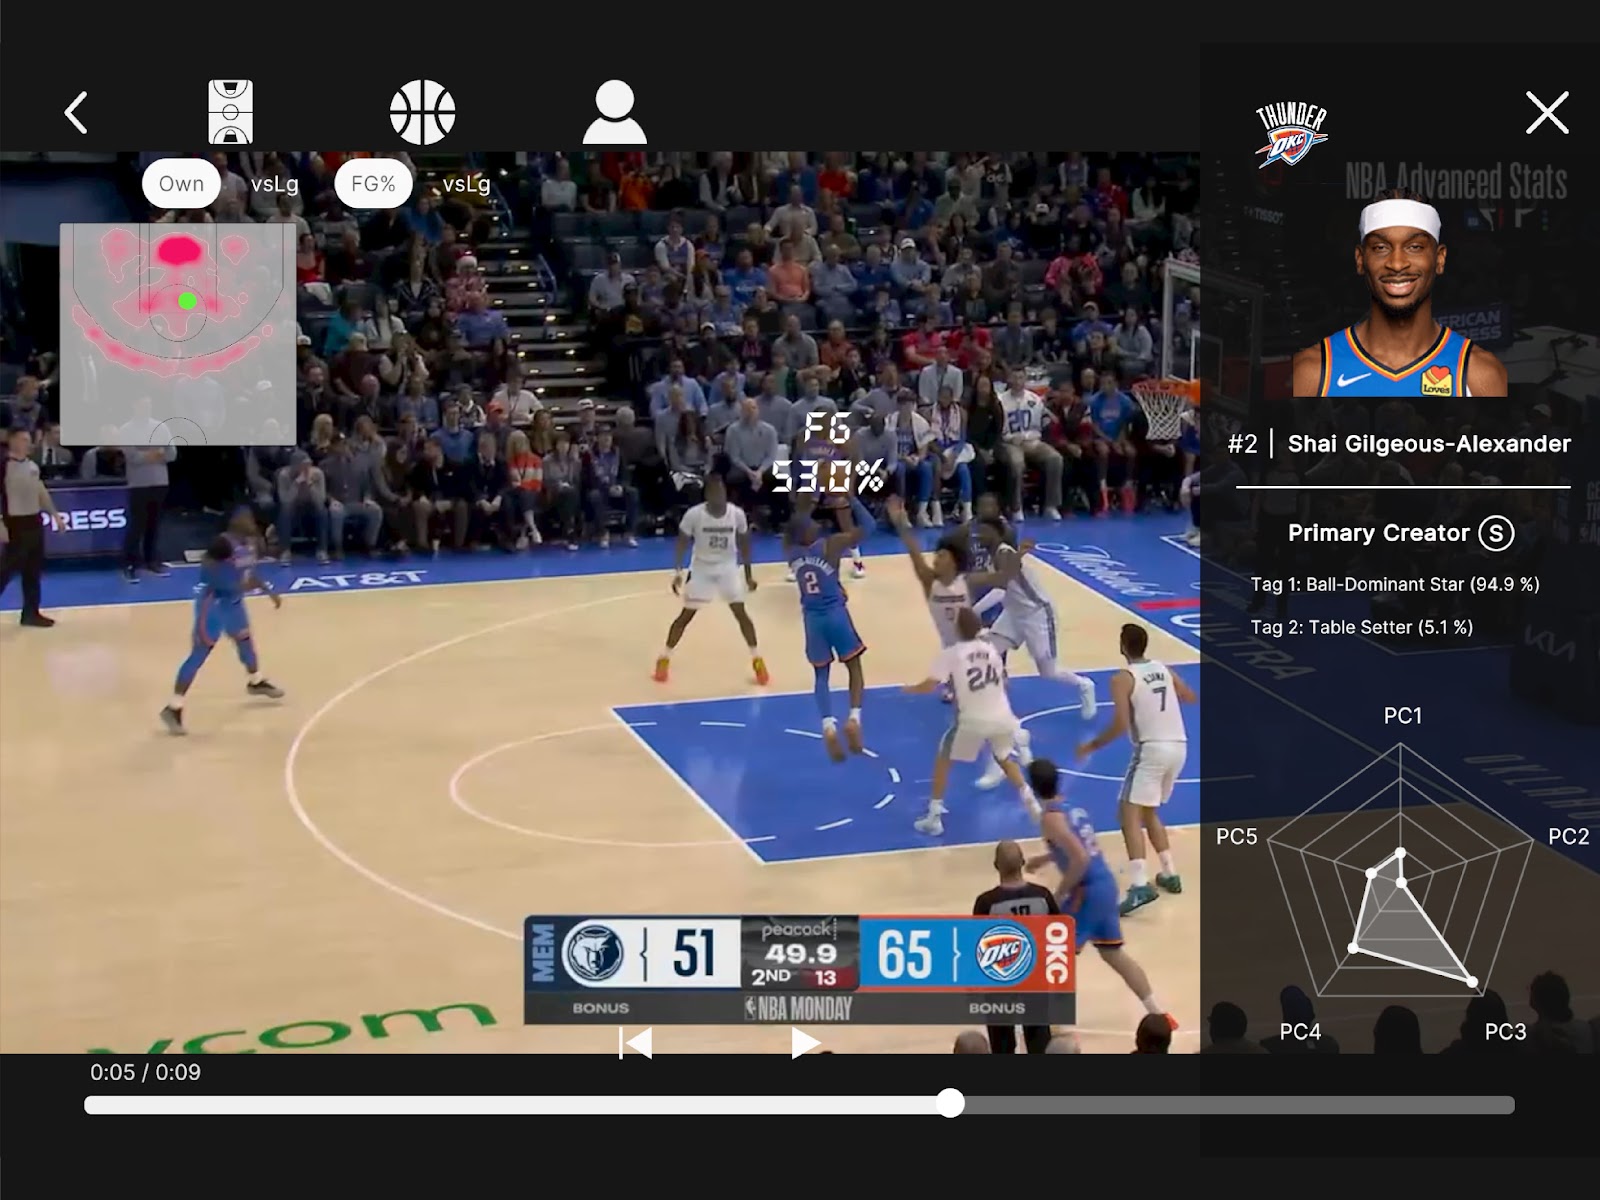
そこで本研究では,選手のシュート傾向や特徴をハイライト映像上に重畳表示する可視化システムを構築した.具体的には,選手の頭上へのシュート成功率表示,詳細な選手情報を提示する選手情報パネル,および選手位置と連動したヒートマップを実装した.さらに,映像とデータの同期制御を行う再生バーを統合したインタラクティブなインターフェースを構築することで,観戦の流れを妨げることなく,状況に応じた情報取得および理解支援を可能とした.
分析手法においては,映像から抽出したトラッキングデータとシュート記録を統合し,位置別の成功率を定量化した.また,選手の役割を反映する29種類の統計指標に対し,主成分分析およびクラスタリングを適用した.その結果,選手を8種類のタイプに分類し,各分類内での相対的な貢献度を5段階のランクとして定義した.これらの分析結果を,顔写真や5つの主成分を用いたレーダーチャートと統合し,選手情報パネルとして視覚化した.
本研究の特徴は,プレー映像上にデータを統合的に重ねて表示することにより,観戦の文脈に沿った形でプレー判断および選手特性の理解を同時に支援できる点にある.また,多数の専用カメラを必要とする既存のトラッキングシステムとは異なり,ハイライト映像のみを用いた解析手法を採用することで,低コストかつ導入しやすい可視化環境を実現した.以上より,本研究は,映像とデータを統合した可視化表現によって,バスケットボール観戦における理解支援の可能性を示したものであり,観戦体験の高度化に寄与することが期待される.
In recent years, data analysis and visualization technologies have advanced rapidly in the sports field. This study addresses the gap between gameplay comprehension and data utilization in basketball spectating. The objective is to develop a visualization method that allows viewers to intuitively and quantitatively understand players’ decision-making contexts and characteristics. While detailed data, such as shooting percentages and locations, are increasingly accessible, they are often presented separately from the video, hindering a seamless viewing and analytical experience.
To resolve this, this study developed a visualization system that overlays shot tendencies and player characteristics onto highlight videos. Specifically, the system features shot success rates displayed above players' heads, detailed information panels, and heatmaps synchronized with player positions. By integrating a playback bar that synchronizes video with data, the interactive interface enables users to access information without disrupting the flow of the game.
The analysis involved integrating tracking data from video footage with shooting records to quantify location-based success rates. Furthermore, principal component analysis (PCA) and clustering were applied to 29 statistical indicators. This resulted in the classification of players into eight types, with relative contributions within each category defined by a five-level ranking system. These results were visualized in player information panels, incorporating photographs and radar charts representing the five principal components.
A key feature of this system is its ability to support the simultaneous understanding of gameplay decisions and player traits by contextually overlaying data onto video footage. Unlike conventional tracking systems that require multiple dedicated cameras, this approach utilizes highlight videos alone, realizing a low-cost and deployable visualization environment. In conclusion, this research demonstrates the potential of integrated video-data visualization to enhance understanding in basketball spectating and contributes to the advancement of viewing experiences.
Map
この作品は Gallery A : A20にてご覧いただけます。
この作品に関連した作品・研究

お気に入りの作品
© 2026 Department of Industrial Art, Tokyo Metropolitan University